The Evolution of Our Analytic Platform: The Continued Marriage of Hadoop and OLAP
Almost three years ago in 2012, I wrote about the marriage of Hadoop and OLAP at Zoosk, which frankly was like witnessing two people finding their soulmate. They both compliment each other perfectly, rounding out each other’s shortcomings, and highlighting each other’s strengths. Sparks were flying everywhere!
And almost three years later, the marriage is still going stronger than ever!
How things stay the same
As a solid testament to a good marriage (or a good architecture in this case), there are many things that have stayed relatively the same in the last three years.
- Hadoop still collects all of our web generated “Big Data.”
- We still have a EDW that consolidates many of our “Small Data” (financial data, marketing data) with the big data aggregates.
- OLAP / BI still provides an easier way for our users / management to analyze our data, especially on performing longer-term trend analysis.
How things have evolved
But also like any good relationship, things do evolve so that the two parties can work even better together, and that’s especially true with a rapidly changing technology stack such as Hadoop.
Lame analogies aside, the analytics industry is definitely converging, with lines between Big Data and traditional DW/BI blurring. And it is especially apparent from the architecture diagram perspective, compare to what we had three years ago:

And here are the main technological/architectural enablers that have helped us evolve our analytic platform at Zoosk:
Hadoop as an Enterprise Data Hub
Historically, the defacto choice for an enterprise data hub or data warehouse has been an RDBMS. However, it has been increasingly hard for traditional RDBMS technology to keep up with the tremendous growth in data volume, as well as manage the complexity of large scale data ingestion processes.
As Hadoop technology matures, it is increasingly feasible, and sometimes even essential, to leverage Hadoop as the technology of choice as an Enterprise Data Hub.
Historically, RDBMS as a data hub means that there is a lot of work in ETL develop to bring data from various sources into a centralized hub. Data needs to be cleansed, merged, and scrubbed into a structured format, typically modeled in Third Normal Form to be stored efficiently in the RDBMS. This work could take months or years to do.
As data volume grows, the answer is typically to scale up, which means purchasing a bigger disk or SAN for the server, purchasing faster CPU, getting more memory, etc. Once it hits a certain point, there would be no option but to scale out, and a lot of complexity would kick in, especially when it comes to MPP (Massively Parallel Processing) databases.
Hadoop as the Enterprise Data Hub, however, provides multiple advantages to the RDBMS architecture:
Easily manage a large amount of data
- Hadoop can store an unlimited amount of data, in its original format, for as long as one needs. There is no need to transform / cleanse the data into a structured format, which RDBMS typically requires.
- Scaling out in Hadoop is built into the architecture, and can be done in minutes. Adding extra servers to cluster, or allowing existing servers in cluster to fail, is an integral part of Hadoop.
- Redundancy is built in. There is no need to manage a complex RAID, or LUN/Filegroup optimization that are typical to standard RDMBS architecture.
Low cost parallel data processing
- Parallel processing is built into the architecture. Once data volume gets above a certain threshold, it’s much more cost effective to run the workload in hadoop than in some complex, expensive MPP RDBMS database.
- As Hadoop technology advances, parallel data processing workloads are performing much more efficiently and at a lower cost than their RDBMS counterparts. Technology such as Spark, Impala, etc. enables us to process large amounts of data at a speed that was very hard to achieve before.
Enterprise Analytical Hub
- On top of providing a cost-effective platform to store raw data indefinitely, Hadoop enable users to analyze the data immediately, at a speed not seen before. Impala / Drill / SparkSQL enables users to perform analytical queries with hundreds of millions of rows, and get results within seconds.
- Also, analytical functions are not limited to just SQL, Hadoop offers options for full-text search, machine learning, and scripting, on top of connectivity to datawarehouse as well as visualization tools such as Tableau.
Hadoop adoption of SQL language
Early versions of Hadoop supported map-reduce programming using Java-based implementations to process data at a relatively low level. Over time, a SQL programming layer called Hive was introduced on top of map-reduce that made most of the common data processing patterns much easier to implement. Hive supported simple SQL for bulk operations on data such as data loading and aggregations.
But, more importantly, it marks the first time when a typical data analyst without programming training could effectively go into Hadoop and run SQL in order to get data out of the logs. This legitimizes Hadoop as a data hub, which can also support business analytical needs.
While Hive applied a nice high-level facade to raw map-reduce, it wasn’t designed with a lot of the optimizations and internal efficiencies of modern DBMS implementations. It relies heavily on disk I/O, which slows down the completion of queries and makes large joins practically impossible. It doesn’t take as much advantage of indexing and memory caching as it should. It’s a reliable work-horse, but not flashy.
As Hadoop technology has advanced in the last few years, a second generation of SQL implementation has emerged, with much better performance characteristics, and this includes Impala, SparkSQL, Drill, Phoenix, etc. A typical HiveQL that groups by tens of millions of rows to produce an aggregated result could take tens of minutes; but with the latest implementation, it usually only takes seconds.
Even as a programmer who can write Java mapreduce, or Python hive streaming code, it’s usually magnitudes faster to use Impala to get my results. Furthermore, all existing data analysts who are SQL trained can now actively query the Hadoop cluster and gain insights from it, instead of having to learn Java or Python. And this speaks loudly on how quickly Hadoop is maturing as an analytical platform for the masses.
Advances of columnar technologies
In terms of analytical queries, a recent major technology breakthrough is the wide adoption of columnar technologies. At Zoosk, all of our data pipelines have a columnar component to them that give us 10–100x better performance than without!
- Hadoop Columnar storage – Parquet
- SQL Server OLAP Columnar storage – Vertipaq
Analytical queries are a natural fit for columnar storage. Your base table could potentially have a large amount of columns, but your analytical queries typically only GROUP BY a small number of them. Traditional row-based storage requires the engine to read the entire row of data just to find the columns in need, but columnar storage negates that need, and thus minimizes I/O. Moreover, columnar storage typically has much better compression characteristics because of low cardinality within a column (low amount of distinct values).
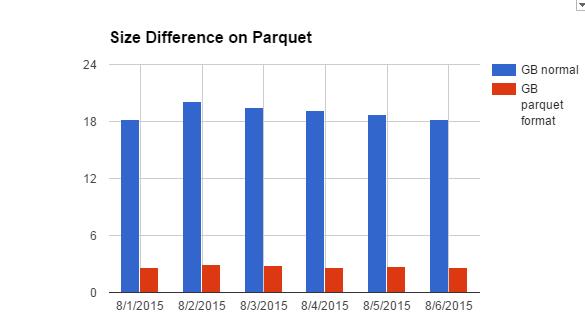
Parquet, a general purpose columnar file format for Hadoop, was introduced by Cloudera and Twitter in 2013, which in turn was inspired by Google’s Dremel paper. It brought a lot of efficiency to our analytical workload. With our internal tables, on average, we see our parquet tables are about ⅓ – ⅙ the size of the original raw tables after compression. Not only does the drastic reduction in size help with overall storage cost, but it also improves the efficiency of scanning the data, thus leading to much shorter processing time.
For example, this is the size difference on one of our logs, between the raw logs size (in blue) and the parquet table size (in red). Number is in GB.
Coupled with Impala, Parquet tables can be 10–100x faster than what we used to do with Hive and Seq/Avro files, depending on the query. Below is a typical query we run, which counts the number of actions as well as unique user IDs for a set of given interactions over a span of days/weeks. The query time it takes in seconds between the different types, on average is:
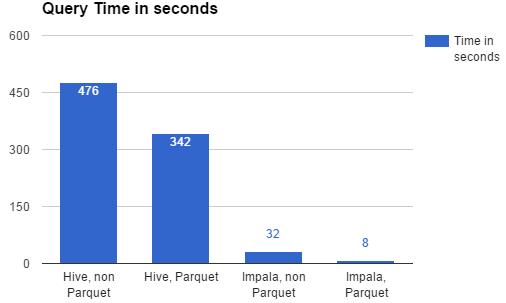
Columnar storage and Impala also makes very expensive operations, such as counting distinct value (such as UserIDs) much much faster, sometimes 100x faster compared to Hive, non Parquet.
SQL Server Analysis Services, or any OLAP technologies out there, really enable users to quickly slice and dice the underlying data in a self-service manner. However, when we have billions of rows a month, traditional multi dimensional OLAP starts to show its age. When our users cannot do any quick trend analysis in OLAP with the data, and expect results quickly, we know we have to evolve. The columnar engine, Vertipaq, enables our users to continue to slice and dice the data in whatever dimensions they see fit, with billions of rows of underlying data, and still get results in seconds.
These columnar technologies are game changers for how we use our data. Gone are days when we don’t analyze our data as much as we should because we run out of patience waiting for results. Now we can really analyze our data in near real time, and adjust our strategy accordingly.
Advances of BI visualization tools
BI Visualization tools have also come a long way, and are a great supplementary tool to our detailed reports. Visualization tools such as Tableau enable us to quickly integrate several data feeds for ad hoc analysis, which would otherwise take too long for a traditional ETL integration, and spot trends that may otherwise be harder to spot in traditional numerical reports.
These visualization tools also enable us to quickly publish reports that can be consumed in many different platforms, such as phones, and tablets, as well as pushed to our users’ email inboxes.
Advances of analytical front end from Hadoop
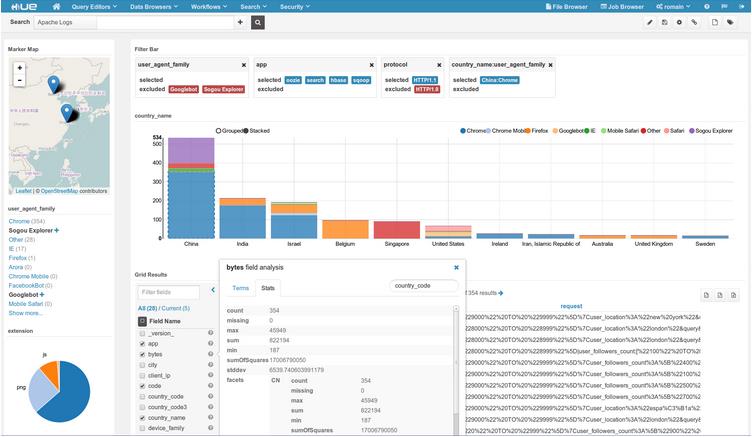
Lastly, even with all the technical advances, it’s sometimes still a barrier to ask our non-technical users to just “query the Hadoop” via a command line. That’s why Hue is another game changer for our users. Hue is a relatively simple web UI that allows our users to run their hive/Impala queries with modern features such as auto-complete interaction SQL prompt. Our users can also browse our data store and view a sample of data from any table just with a click of a mouse. Moreover, results are formatted nicer compared to command line, and can be easily downloaded as csv or xls.

Conclusion
As you can see, the data technology marketplace has evolved at a breakneck pace in the last 2–5 years, and there are many more exciting technologies out there that we’d like to try but haven’t! However, nowadays, we can do things that none of us data professionals imagined ten years ago.
We are collecting and processing unprecedented amounts of data and, at the same time, we are enabling our users to self-service and analyze in a quick, efficient, and graphical way to gain insights.
At the end of the day, all these advances allow our users to think about the insights more, and worry about the technical details less; and that’s exactly what an analytical platform should be.